Hum - Infrasound Measurement with USB Microphone
In this presentation, I will show you how to measure hum and infrasound using a calibrated USB measurement microphone.
Data analysis is performed using the open-source software SCILab.
The script, user manual, and report template are provided free of charge by engineer Edwin Krasser.
The first class 1 WS2F-compliant infrasonic measurement microphone with USB interface on the market.
It is equipped with a pre-polarized 1/2” microphone capsule that has been specially developed for low-frequency applications and works in a linear range from 1 Hz to 20 kHz.
The iSV1611 USB microphone preamplifier is able to perform measurements in two different level ranges simultaneously.
The measurement of infrasound is possible with very low ambient noise from a level of 15 dBA.
The USB microphone preamplifier is designed for three different sampling rates: 48 kHz, 96 kHz and 192 kHz.
This allows the iSV1611 digital preamplifier to be combined with other microphone capsules, e.g. for ultrasound or high-level measurements.
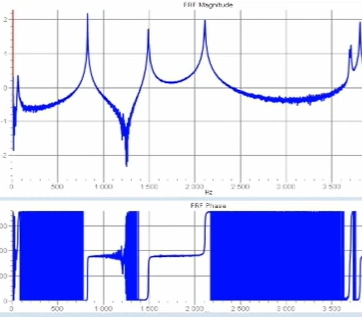
FFT Analyser Software - FRF - EMA - ODS - NVH Analyzer Software for R&D
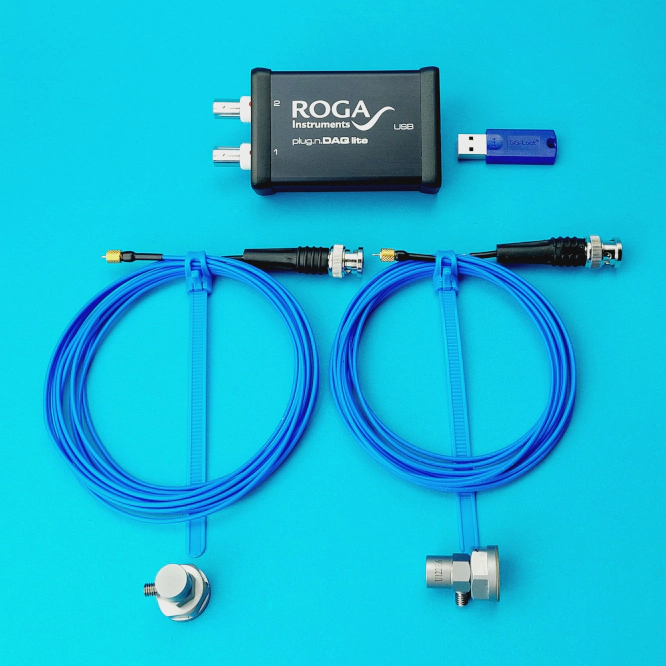
Features
● 1 x 2 channel IEPE Interface USB DAQ
● 2 x Accelerometers, 50 g measuring range
● 2 x 10-32 BNC sensor cables, 3 meters long
● 2 x Insulating magnetic mounts with 100 Nm holding force
● NVH-FFT vibration analyzer software
Applications
● General vibration measurement
● Machine monitoring
● Bearing damage early detection
● Impact hammer testing – Modal hammer measurement
● Measurement of vibration acceleration, displacement, and velocity
Analysis of the deflection shape during operation using an impulse hammer and recording of raw data
Operational Deflection Shape (ODS) analysis software can be used independently or in conjunction with other applications.
This software offers customizable workflows and integrates all the necessary features for ODS measurement and analysis, such as time, spectrum, and rise/fall phases.
This brief presentation illustrates the recording of data from nine IEPE accelerometers mounted on a steel plate.
The steel plate is subjected to excitation by an impact hammer to generate raw data for operational vibration analysis.
Free Measurement Data Acquisition Software - Measurement Data Recorder Software
RogaREC
The RogaREC software was developed for a wide variety of test and measurement devices, enabling the use of a front-end system such as a PC-based data recorder; RogaREC also works with any PC sound card.
RogaREC’s key feature is its ability to simulate a recorder, eliminating the need for a user manual.
RogaREC supports the analog input channels of various sound cards, including Plug.n.DAQ and RogaDAQ2.
The measurement bandwidth is specified in Hz or kHz, depending on the device.
The display allows switching between bar graph and oscilloscope views.
Channel overload indicators for each channel, pre and post triggers, and a recording time function complete the RogaREC product.
Channel data is saved in the TEAC TAFFmat file format, which is compatible with NVH Analyzer, FlexPro, DaDisp, DiaDem, ArtemiS, FAMOS, LMS, and other post-processing analysis products.