FFT Vibration Analysis Training - Step by Step Tutorial
System requirements
- Operating system: Windows 10 or 11
- Always run the program with administrator rights
- Processor: 2 GHz processor (or faster)
- RAM: 32 GB for 64-bit
- Hard disk space: 50 GB or more
- Graphics card: DirectX 9 or higher with WDDM 1.0 driver
- Display: 1920×1080
Licensing of the NVH Analzyer Software
This demonstration illustrates the licensing process for NVH analysis software with a USB dongle.
From November 2026, the NVH Analyzer software will be supplied with a USB licence dongle.
Here you will also receive a brief introduction to how to use the software.
NVH-LicenceRequest.NVA Model is no longer supported.
Existing NVH Analyzer customers can purchase a USB dongle for a fee of 290 euros.
NVH Analyzer Software - First Steps and Explanatory Videos Gallery
NVH DAQ
Card Setup
analysis functions setup
additional software settings
comparison of transfer functions
animation of structural models
Question:
In the display windows, there is an average variant of the 1/3 octave display and of the FFT.
Does this mean that the spectra are averaged over a certain period of time?
Response:
It is averaged continuously è between start and stop
Question:
How can I export WAV files to compare them with other analysis programs under the same scaling conditions?
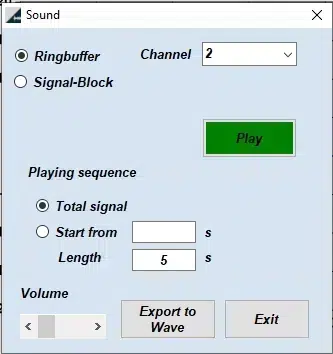
Response:
After you have made a measurement, listen to the file briefly by clicking on Play. At this moment the file is scanned for the highest amplitudes, and an automatic level is determined.
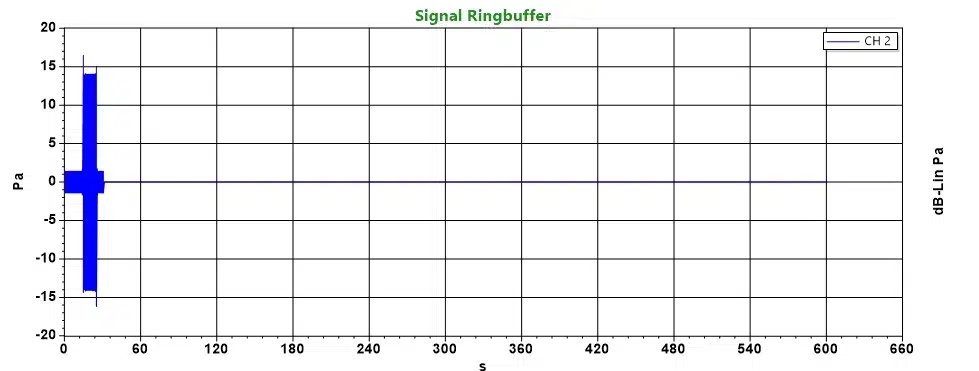
Here is an example measurement with microphone and sound calibrator.
The first 10 seconds were 1.49 Pa peak (94dB), and then I switched to 114 dB; about 14.9Pa peak.
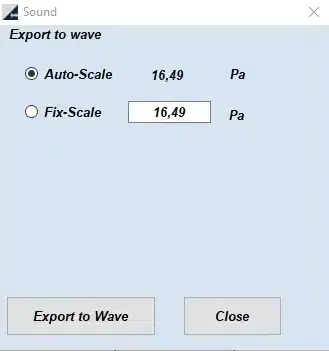
When switching from 94dB to 114dB, you can see an overshoot here that drove the scale value out to 16.49 Pa.
In this example of the highest amplitude, I would then set the value to 20 Pa for WAV export.
With this Fix-Scale setting you can later compare all exported WAV files.
The peak values are displayed here in the physical unit of the sensor.
Question:
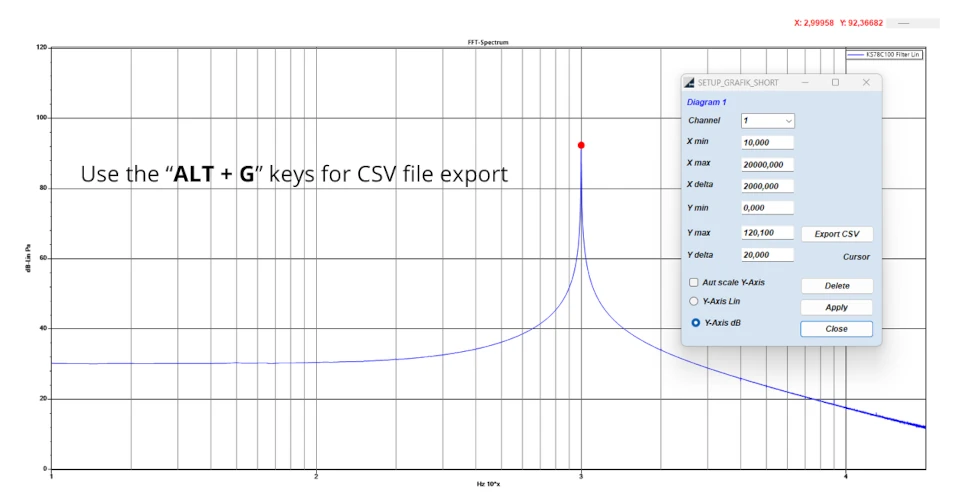
The diagrams of the FFT have as X-axis the frequency
And on the Y-axis the acceleration in m/s² or the sound pressure in Pa.
How is the Y-value formed?
Is it something like the mean value of the sound pressures of a certain frequency in the considered time window of the FFT or the sum value of the sound pressures.
Response:
An FFT spectrum is calculated with a certain number of lines or FFT resolution Delta F.
The FFT spectrum or (Fast Fourier Transformation) has an amplitude for each frequency. The amplitude can be calculated either as peak or RMS.
In the software, the amplitude of the FFT is converted to RMS.
y(t)=∑ Amplitude_peak sin(2 π f t) = ∑ √2 Amplitude_RMS sin(2 π f t)
Amplitude_peak= √2Amplitude_RMS
Question: I can’t find how to export the data.
We have the Lite version. I can’t find it in the documentation. Can you describe the process?
Answer: First click with the mouse cursor in the graphic you want to export.
Use the “ALT + G” keys for CSV file export