Skip to content

Automated modal hammer - impulse hammer

Similar to the manual guidance of an impulse hammer, the design ensures a friction-free suspension to guide the mass.

This ensures precise impulses and avoids double blows. The energy, or impulse force, is applied electromagnetically.

▪ Simple adjustment of the impulse force via the control unit
▪ Modes for single and continuous pulses
▪ External trigger input for integration into existing test systems
▪ Installation in seconds using a standard measuring stand
▪ Measurement of rotating shafts with e.g. non-contact eddy current sensors (Fig. 1)
▪ Highly repeatable pulses in force and direction (no operator influence)

AH2500

Advantages

◼ Highly repeatable pulses in force and direction
◼ Automated, continuous pulse excitation
◼ Small size for easy integration
◼ Safe excitation of rotating shafts

Application examples

◼ Spindle final acceptance test
◼ Process optimization
◼ General dynamic measurements
◼ Experimental modal analysis
◼ FEM model validation

Benefits

◼ Highly repeatable impacts in power and direction
◼ Automated, continuous excitations
◼ Small size for easy integration
◼ Safe excitation of rotating shafts

Typical Applications

◼ Spindle EOL testing
◼ Process optimization
◼ General impact testing
◼ Experimental Modal Analysis
◼ FEA Model Validation

Exemplary measuring setup and force signals

Measuring setup
Force Results

Application examples:

The main application is the safe and precise excitation of rotating shafts such as machine spindles, electric motors or gear shafts. The ability to excite rotating shafts provides a deep insight into the mechanical properties of the system under investigation. Typical application examples are listed below:

Spindle EOL-Test

▪ Axial Stiffness as an indicator for the bearing preload
▪ Monitor the floating bearing function during heat up and                acceleration by axial FRF
▪ FRF as a spindle fingerprint

Process optimisation

Measure tool and speed specific FRF:
▪ avoid machining with critical spindle speeds
▪ better surfaces and less tool wear
▪ longer bearing and spindle lifetime

General Spindle Dynamics

▪ Measure the spindle compliance (static / dynamic)
▪ Indicator for dynamic spindle performance
▪ Validate FEA models

Structural dynamic Measurement

▪ FRF measurements of the machine structure
▪ Modal analysis using continuous impulse mode

TFM software

The TFM software (Figure below) comprises the data acquisition, processing and storage for common and rotational specific measurements:
▪ Fast setup using absolute (acceleration) or relative (eddy current or capacitive) sensors
▪ Automatic run-out compensation when measuring rotating shafts
▪ Continuous data acquisition and visualization of the last impact (force and response)
▪ Calculation of the FRF and storage in generally readable *csv format (e. g. Excel)
▪  Load historical FRF for a direct comparison

TFM Software Result

TFM Software (visualization)

Optional services
Hardware

▪ Non-contact displacement sensors for measuring the vibration of rotating shafts
▪ Customized holders for stationary integration in test rigs
▪ Hammer tips with varying degrees of hardness

Software and consulting

▪ Integration of the impact hammer system with data evaluation, interpretation and handling in customers infrastructure
▪ Analysis of the data in the context of the spindle system (EOL testing, sample tests)
▪ Advanced employee training on measuring rotating shafts and interpreting the results in the context of rolling bearing systems

Technical

What do I have to consider in order to perform a correct EXCITATION?

For a correct excitation, the following must be ensured:

Excite the frequency range of interest with high amplitude (above the background noise of the sensor)

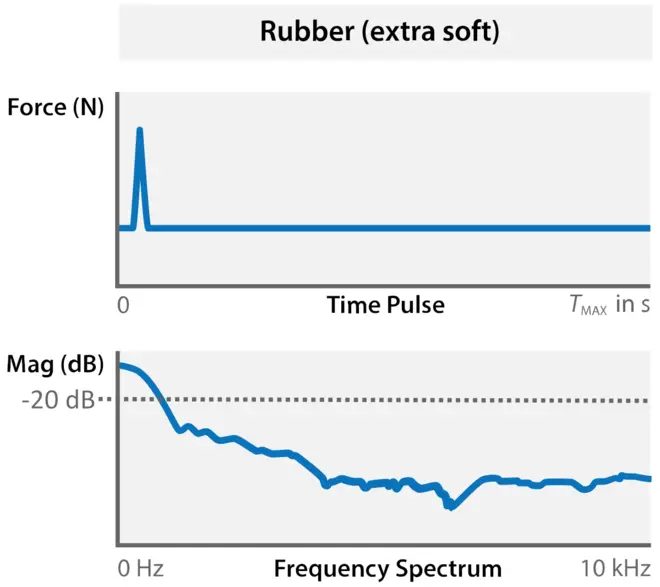
An amplitude uniformly distributed over the frequency range to be examined

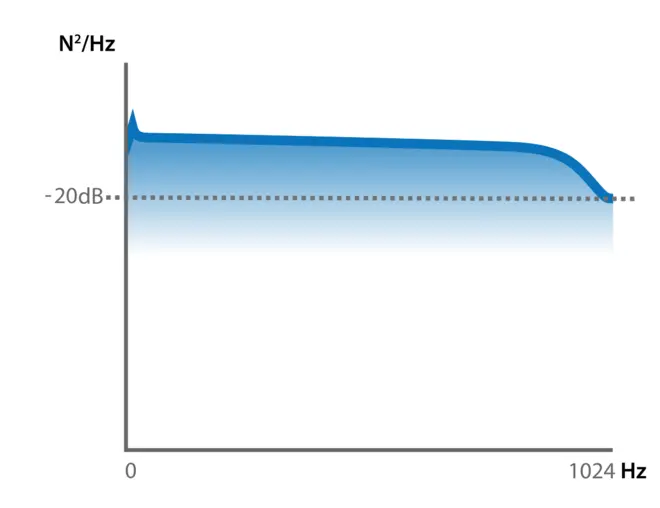
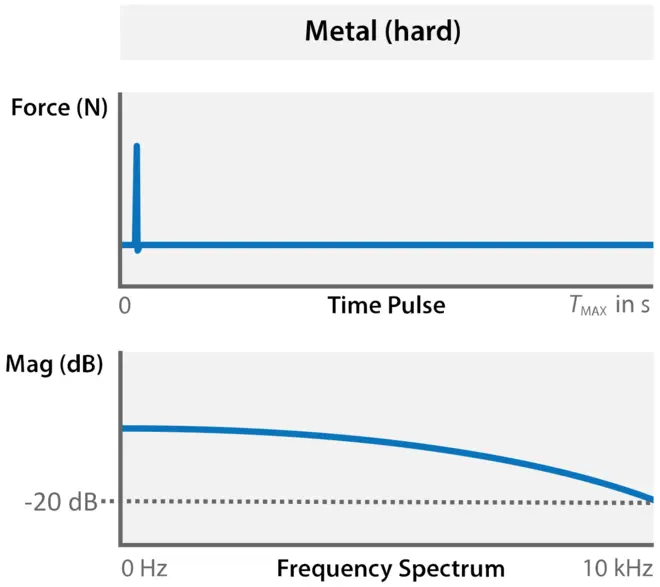
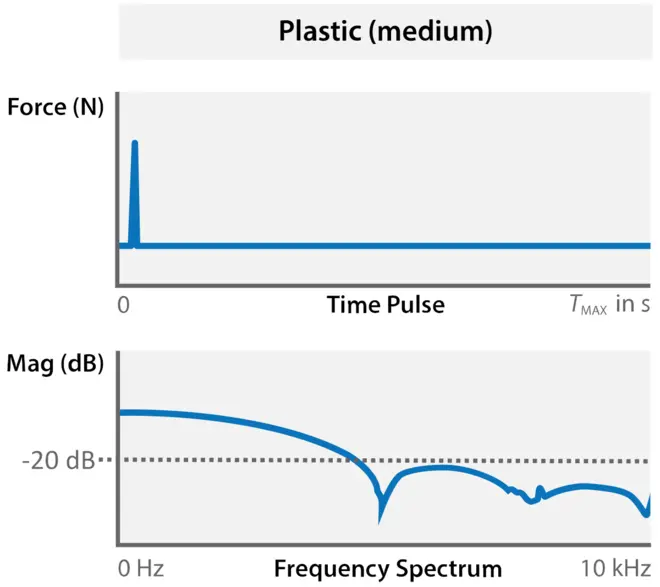
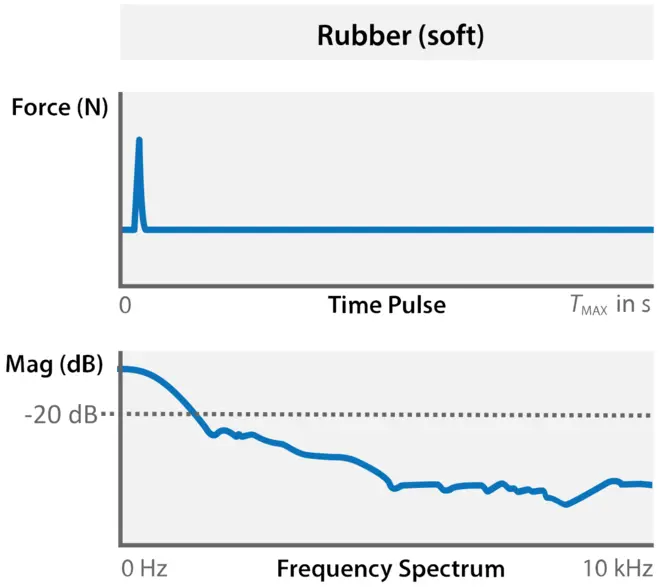
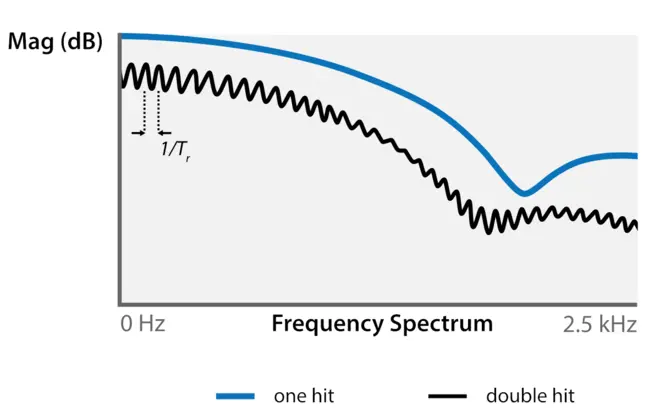
Enough energy must be generated to excite the entire frequency range of interest, but not significantly beyond. The force must not drop more than 20 dB in the excited frequency range to get a sufficient energy input.

It must be ensured that enough force is induced into the structure to excite the modes of the structures.

A correct excitation should have the following course over the frequency range to be examined:

When do I use which hammer tip for excitation?

The general idea is that resonant frequencies can be more easily identified by applying the same force level over the entire frequency range.

The width of the input force is controlled by the duration of the shock pulse. However, the shorter the duration of the impulse, the wider the frequency range response.

To controll the input force frequency range, you can change the hammer tip in two ways:

Hammer mass – Reducing the mass of the hammer tip causes the hammer to touch the structure for a shorter time. Because the reduced mass allows the hammer to reverse direction more easily after hitting the structure, thus reducing the contact time.

Hammer tip stiffness – Increasing the stiffness of the tip also allows the hammer to shorten the time of contact. For example, a rubber tip could be replaced with a metal tip.

A hard tip has a very short pulse and excites a wide range of frequencies. Whereas a soft tip has a long pulse and excites a narrow frequency range. But the hammer tip itself does not completely determine the excited frequency range. The local flexibility of the structure must also be taken into account.

Generally applies: The lighter the hammer and the stiffer the tip, the higher the excited frequency range.

Choice of tips:

How do I recognize a doublel-hit excitation?

A double hit excitation can often be detected in the time domain as well as in the frequency domain.

If a second peak occurs in the time domain, this is an obvious evidence for a double hit excitation.

If this is not the case, it is possible that the second peak is just too small or too close to the first peak. In this case, the double hit excitation can be detected in the frequency domain.

It shows one of the following significant forms:

What is the effect of a double-hit excitation on the frequency spectrum?

The effect of the double excitation can be calculated from the time interval between the two impacts.

The following chart shows how the inverse of the time interval affects the interference in the frequency band.